The most significant impact on overall bank management was caused by the introduction of the Expected Credit Loss approach to reflect credit risk in external accounting.
This approach should ensure that a risk provision, which covers the embedded credit risk for all individual deals that belong to a specific segment, is always available.
The extent, to which this risk provision matches with the required risk provision, depends on several factors:
- Quality of macroeconomic parameters – calibration
- Segmentation criteria that are used to identify deals with similar credit risk. Usually limited to a few criteria because of limited processing capabilities. This results in high risk due to distortions in the ECL calculation, since the credit risks of unequal risk objects are offset against each other and no allocation according to their origin is made. Some transactions are allocated excessively high credit risks, others too little.
- Mathematical approach
An optimised risk provision ensures that, in the future, enough capital is available to cover the depreciation of financial assets linked to defaults. This leads, in parallel, to the right “risk-bearing capacity capital” and as a result, it leaves the right space for new business at the same time.
- Too much risk provisioning reduces the capital in the balance sheet, the covering funds in regulatory capital and the capital that can be used for the regulatory capital ratio.
- Too little covering funds ultimately limit the entity in doing new business which will have impact on future profit and loss.
In a perfect world, in which risk provision is not used for "cosmetics" in the balance sheet and income statement, the target is to predict future expected credit losses as precisely as possible.
The analysis of the precision of predictions based on machine learning can be performed by backtesting and compared to predictions based on conventional approaches.
An example of this is the comparison for estimated expected credit losses:
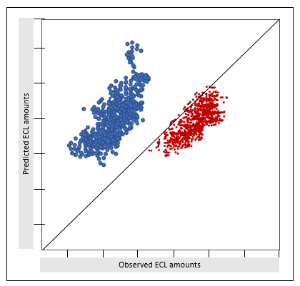
Figure: Comparison of out-of-sample pool-level predictions
For both models, the neuronal network and the conventional approach, the figure shows the observed amount of credit losses during 5 years on the x-axis for each individual deal and the predicted amount of expected credit losses for a 5-year period on the y-axis. The x = y line shows the ideal but hypothetical scenario under which the predicted and the observed number of prepayments coincide. It can be seen that the predictions from the neuronal network are closer to this ideal line than those from the conventional model.
The use of machine learning helps to improve the quality of ECL parameters such as PD, LGD, EAD and macroeconomic parameters. By doing so, the ECL at individual deal level will best reflect the future deterioration in credit quality.