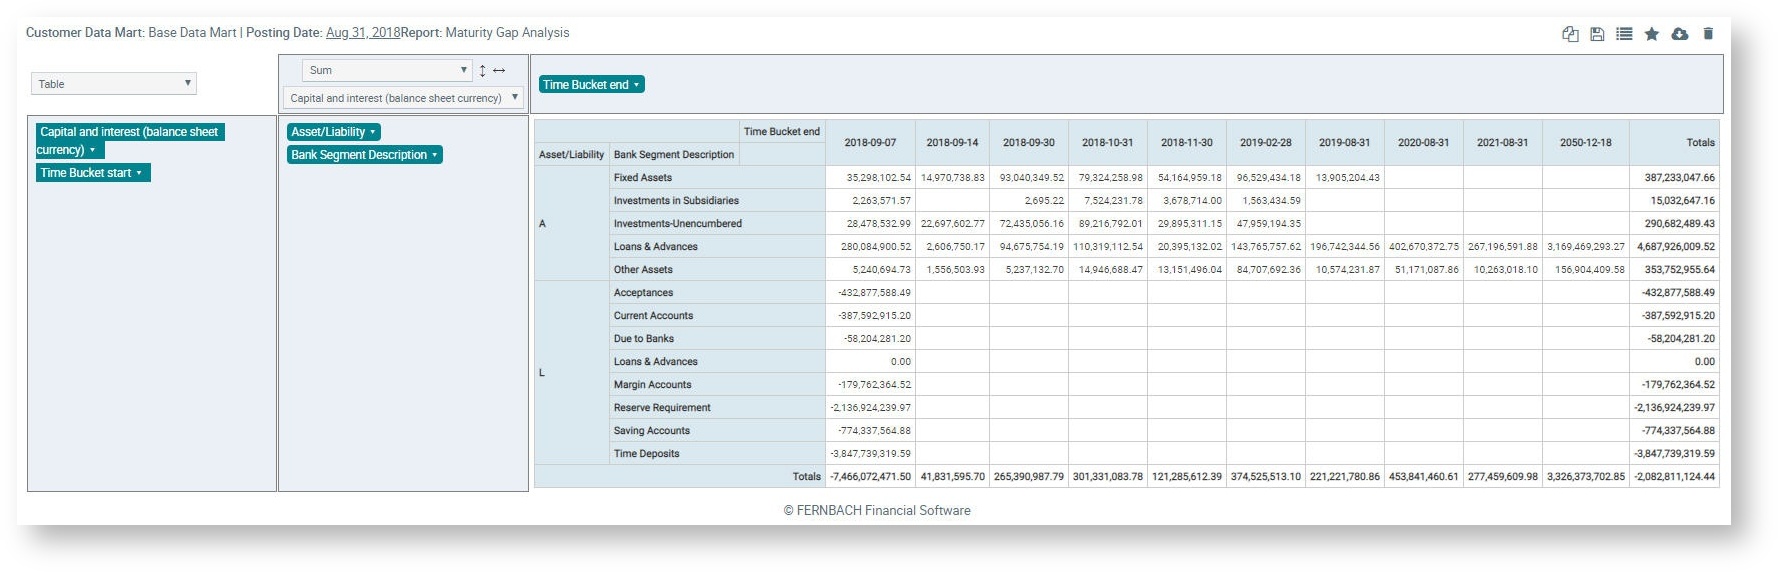
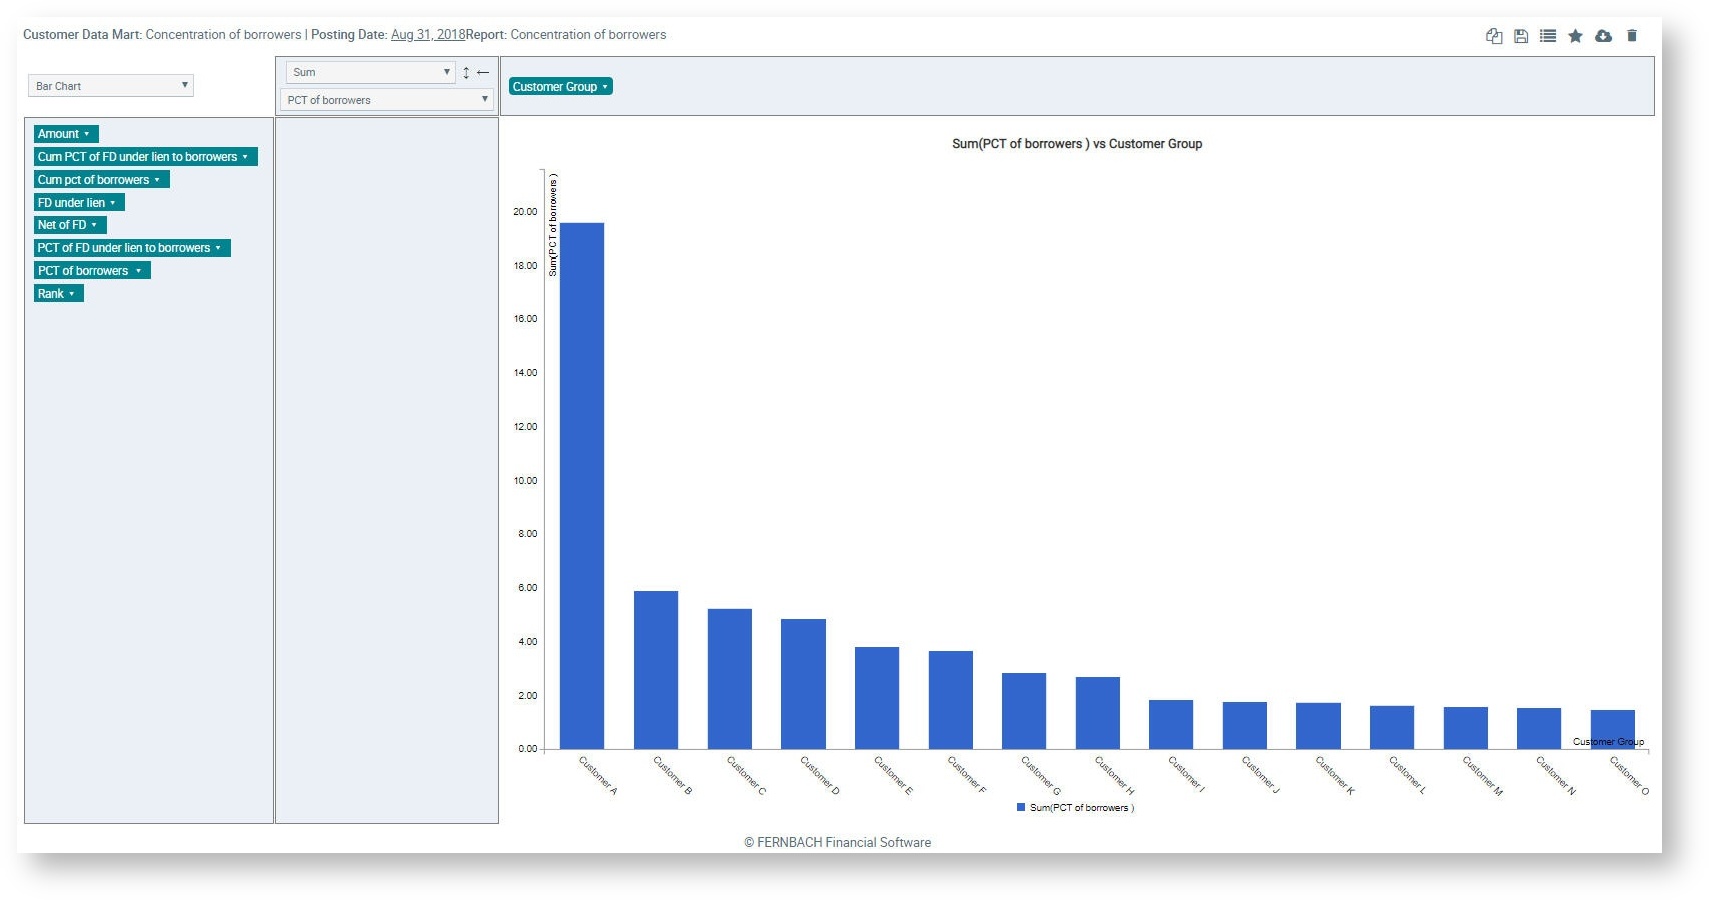
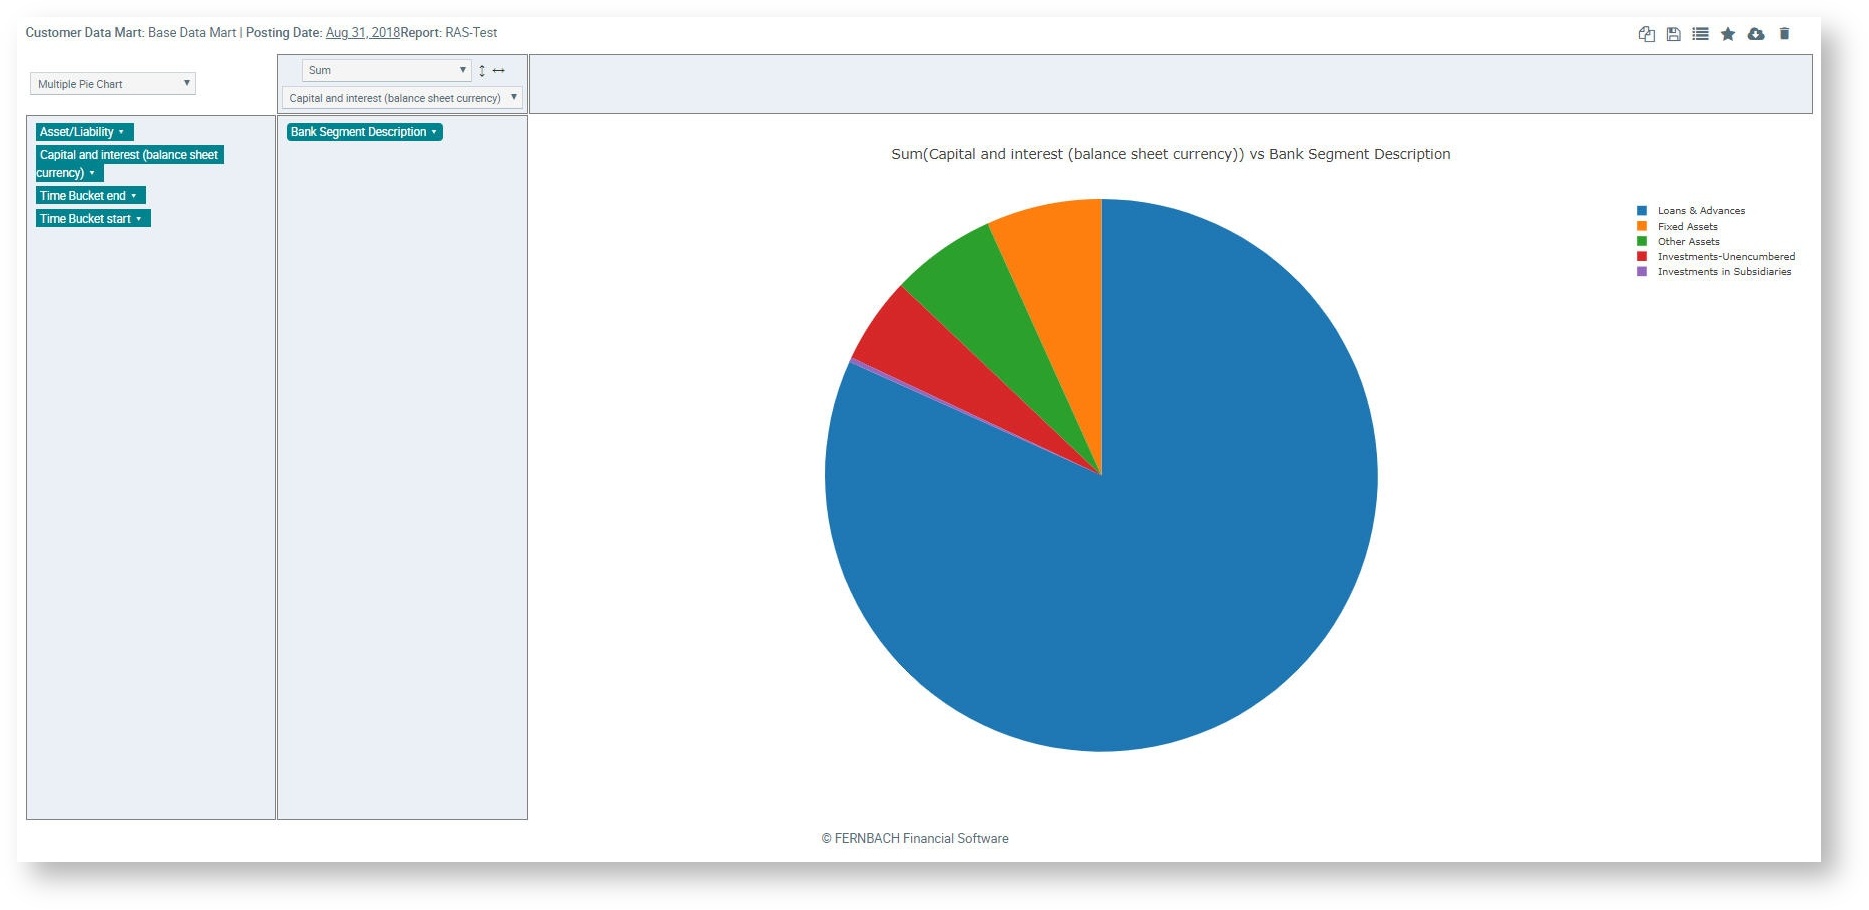
Any view of the data model (usually data marts) can be displayed using the Data Mart Manager, whether it be in tabular form, in the form of a pivot table or as a chart report (line, bar or pie chart).
Although standard <default> views are delivered as part of the various FlexFinance components, they can also be customised for a project and inserted in the mask in just a few minutes.
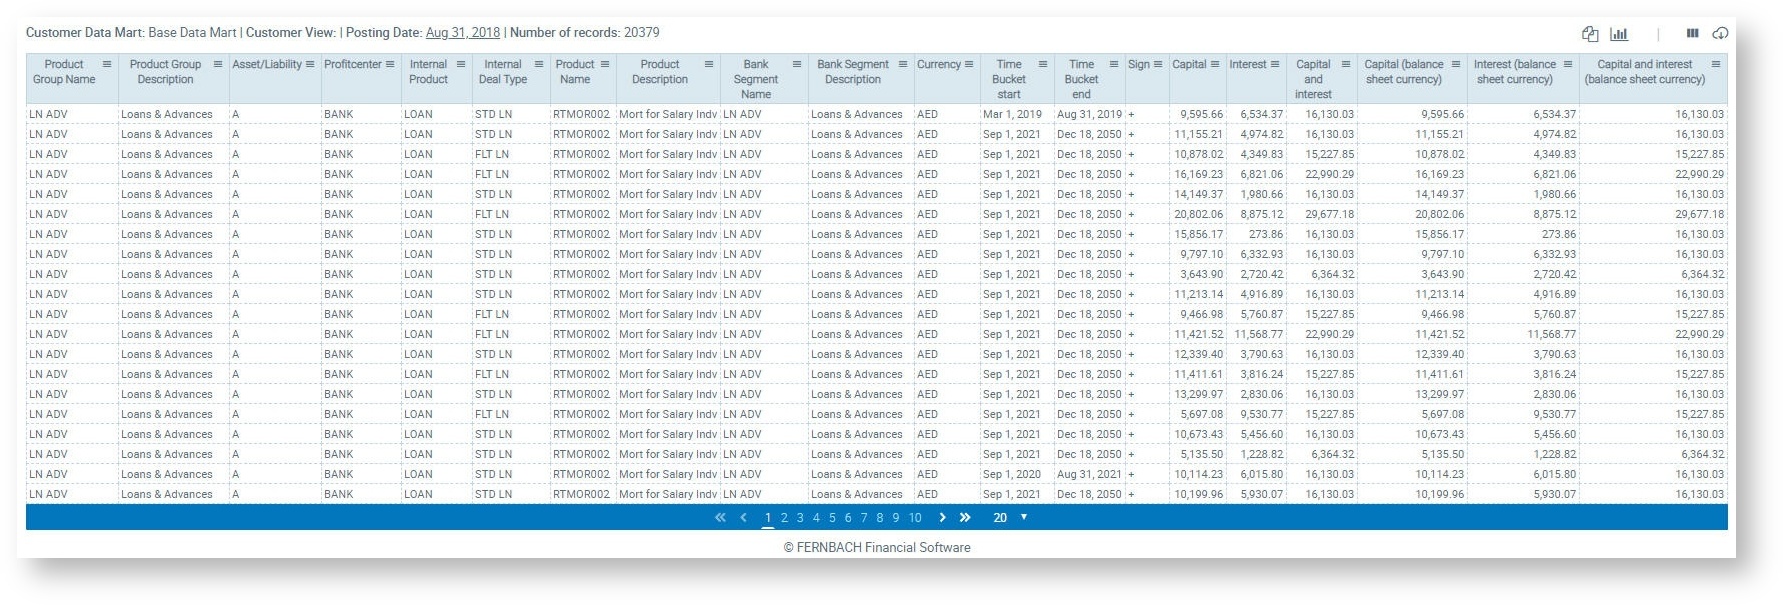
These views are usually very extensive, both in the number of columns displayed and in the number of rows, however they can be edited directly in the mask and then stored as customised views (it is also possible to filter the rows displayed as well as the selection and order of the columns required).
These customised views can in turn be used to define aggregated reports, pivot or chart diagrams. These definitions can be performed directly in the mask and saved as completed reports/charts.
All the views and reports can be exported in any format. Completed, verified views and reports can be marked and transferred to a dashboard (see Dashboard).
It is also possible to select previous data sets/posting dates to compare values over the timeline.
(For details on how to use the Data Mart Manager, please read the manual: Data Mart Manager).